
2026 CRE Lending Outlook
Rates, Spreads & Liquidity — What Borrowers Need to Know
District Capital | January 2026
As we enter 2026, the commercial real estate lending landscape is showing signs of normalization. Interest rate volatility has subsided, credit spreads remain historically tight, and liquidity across major capital sources is strong. For borrowers, this environment presents a favorable window to capitalize on competitive pricing and abundant capital.
In this outlook, we will break down the 3 main components of the commercial lending market:
(1) 10-year UST
(2) Credit Spreads
(3) Market Liquidity
1. 10-Year U.S. Treasury
The 10yr-T is the primary index used by Life Company, CMBS and Agency lenders offering fixed interest rates. When the Fed lowers the federal funds rate, it typically influences short-term borrowing costs directly, whereas the 10yr Treasury yield—determined by market forces—responds based on expectations for inflation, growth, and fiscal policy. It is important to note that a cut to the fed funds rate does not translate into reduced long term borrowing costs. In fact, over the last two rate cuts, the 10yr-T has increased immediately following the fed rate cuts.
2026 Year-End 10-Year Treasury Forecasts
Survey of High-Volume Market Participants (as of Dec 2025):
Put your HTML text here| Institution/Source | 2026 YE 10-YR Yield (Range/Estimate) | Forecast Date |
|---|---|---|
| Financial Forecast Center AI Model | 3.9-4.1% | Dec-25 |
| HSBC (via secondary reporting) | 4.3% | Dec-25 |
| J.P. Morgan Global Research | 4.35% | Dec-25 |
| Kiplinger Outlook | ~4.0-4.2% | Dec-25 |
| Morgan Stanley Fixed Income Outlook | 4.0-4.75% (range) | Nov-25 |
| RBC Wealth Management | 4.55% | Dec-25 |
| Reuters / Reuters Poll Consensus | ~4.21% (median) | Nov-25 |
| Schwab Market Strategy | 4.0-4.30% | Dec-25 |
| UBS Global Wealth Management | ~4.00% | Dec-25 |
| Wells Fargo Investment Institute | ~4.00-4.50% | Dec-25 |
| Citigroup 2026 Market Outlook | 3.75% | Dec-25 |
| Fitch Ratings | ~4.25% | Nov-25 |
| Deutsche Bank | 4.45% | Dec-25 |
| BNP Paribas Economic Research | 4.50% | Dec-25 |
| TD Securities | 3.50% | Nov-25 |
| Bank of America Global Research | 4.00-4.50% | Dec-25 |
| Capital Group | 3.75-4.50 | Dec-25 |
| Congressional Budget Office | 3.90% | Nov-25 |
| Statistic | Yield |
|---|---|
| Low | 3.50% |
| High | 4.75% |
| Average | 4.17% |
| Median | 4.23% |
10-YR Treasury Key Takeaway: While several participants provided ranges, the average and the median rate estimates are in line with current market conditions. The key takeaway from this information is that we are beginning to see less volatility and consensus is that rates should be within a tight range, providing some much-needed normality in the market.
2. Credit Spreads
Lenders often view corporate bonds as alternatives to CRE loans. When corporate yields rise, CRE spreads widen as lenders chase comparable risk-adjusted returns—or risk losing capital to bonds. Studies show corporate market conditions explain much of CRE spread behavior:
U.S. Investment-Grade Corporate Bond Spreads
| Year | Avg Spread (%) | Market Context |
|---|---|---|
| 2016 | 1.30 | Loose monetary policy, modest growth |
| 2017 | 1.15 | Tightening credit |
| 2018 | 1.25 | Market volatility, mild widening |
| 2019 | 1.10 | Strong risk appetite |
| 2020 | 1.90 | COVID-driven stress |
| 2021 | 0.95 | Liquidity returns post-COVID |
| 2022 | 1.40 | Fed tightening cycle begins |
| 2023 | 1.30 | Banking stress & volatility |
| 2024 | 1.10 | Soft landing optimism |
| 2025 | 0.80 | Tight spreads near cycle lows, Trading Economics |
| 2026F | 0.90–1.10 | Modest widening expected |
| Statistic | Yield |
|---|---|
| Low | 0.80 |
| High | 1.40 |
| Average | 1.23 |
| Median | 1.20 |
2026 Forecast US IG Corporate Bond Spread
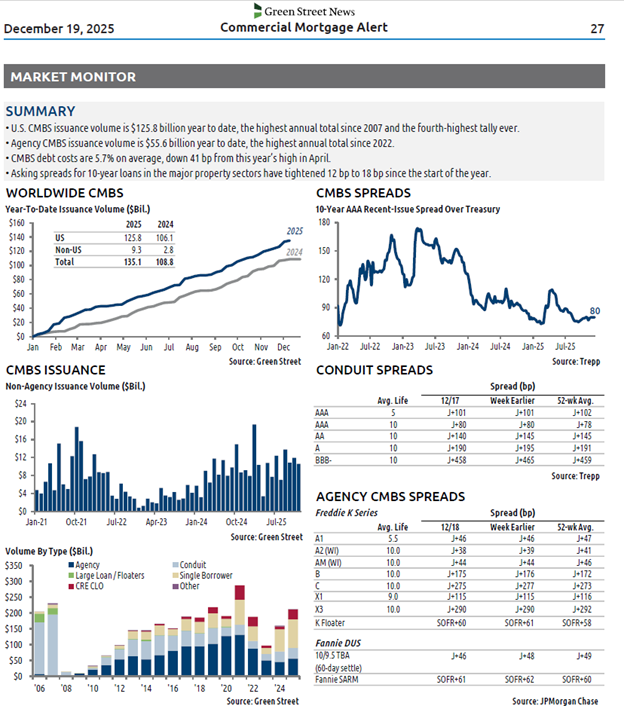
As of January 2026, spreads continue to hover in the 75-82 bps range, reflecting historically tight levels amid resilient economic conditions and Federal Reserve rate cuts. Looking at 2026, analyses from major financial institutions suggest a modest widening, driven by a mix of macroeconomic pressures, corporate supply dynamics, and evolving policy landscapes.
● Markets generally expect slightly wider spreads in 2026 if economic growth slows and credit risk re-prices — roughly 0.90–1.10%.
● If economic data weakens further (recession), spreads could widen more; if confidence stays strong, spreads could stay tight or compress slightly.
Below is another market leader survey asking participants to estimate where they believe both the 10yr T and CMBS spreads will be midyear 2026.
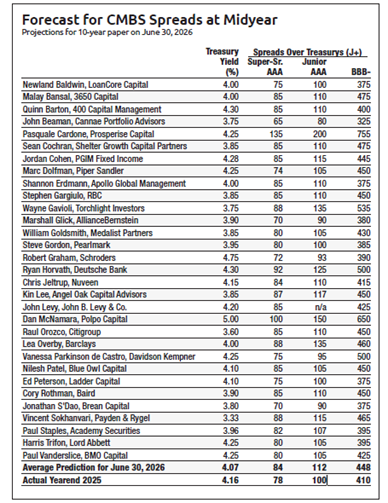
CRE Mortgage Spreads - Below is a snapshot from one of the many publications District Capital monitors weekly. As the chart indicates, spreads are currently at low levels.
Credit Spreads Key Takeaway: Credit Spreads and CRE Mortgage rate spreads are extremely tight right now. The highest probability is a very small widening of IG Spreads over the year.
3. Market Liquidity
Market liquidity is a major driving factor for Commercial Real Estate (CRE) lending, but it works indirectly through several channels rather than as a single on/off switch.
● Tight / Low liquidity → wider credit spreads as investors demand compensation for higher risk and lower ease of trade. Credit availability dries up which leads to a reduced loan volume and slower deal execution. Historically, illiquid markets make lenders more risk-averse, tightening loan standards and slowing transaction volumes.
● Loose / High liquidity → tighter credit spreads and lower borrowing costs. Banks and lenders price debt more aggressively which leads to more CRE financing and transactions.
Now, let's check out the CRE Lending Liquidity Index proxy—a composite measure of how easy it is to get CRE loans. Higher values mean lending is flowing freely, while lower values indicate tighter, more constrained conditions.
CRE Lending Liquidity Index
| Index Value | Meaning |
|---|---|
| High (>150) | Strong liquidity; loans are widely available, spreads are tight, underwriting standards normal to loose. |
| Medium (100-150) | Moderate liquidity; lending active but some caution; spreads moderate. |
| Low (<100) | Tight liquidity; fewer loans being made, spreads are wide, strict underwriting; higher borrowing costs. |
| Year | CRE Loan Volume ($B) | CRE Liquidity Index Proxy |
|---|---|---|
| 2015 | 420 | 90 |
| 2016 | 450 | 95 |
| 2017 | 480 | 105 |
| 2018 | 510 | 115 |
| 2019 | 500 | 120 |
| 2020 | 350 | 85 |
| 2021 | 470 | 110 |
Market Liquidity Key Takeaway: CRE loan liquidity is stable and well-supported across lending channels. Capital availability is broad-based, underwriting standards are rational, and execution timelines are improving.
Other Market Datapoints
Agency
In November 2025, the U.S. Federal Housing Finance Agency announced the 2026 Multifamily Loan Purchase Caps for Fannie Mae and Freddie Mac. In short, agency lenders have been allocated roughly a 20% increase in capped business, meaning they are expected to deploy significantly more capital this year. This is a positive signal for liquidity. Source: FHFA 2026 Multifamily Cap and Definitions
Life Company
At District Capital, we have yet to speak with a LifeCo lender that isn't mandated to deploy more capital in 2026. Two key factors are driving this increase:
● Lower demand for long-term loans over the past few years during periods of rising Treasuries.
● Higher demand for annuities from an aging population.
These trends have collectively led to a larger CRE loan allocation from LifeCo lenders for 2026.
Banks
Overall liquidity was solid in 2025 with most banks well above regulatory Liquidity Coverage Ratios. Larger banks are, for the most part, in a better position than community banks. 2026 Forecast suggests continued liquidity health in 2026.
CMBS
2025 saw strong CMBS liquidity, with AAA spreads much tighter than the stressed 2022–2023 period. Internal guidance suggests 2026 could be a record year for the market.